Chapter 1 Understanding Variation
The central problem in management and in leadership […] is failure to understand the information in variation.
Deming (1986), p. 309, quote attributed to Lloyd S. Nelson
Imagine writing the letter ‘a’ by hand using pen and paper. Figure 1.1 shows eight instances of this letter written by one of the authors. The first seven were produced using the dominant (right) hand, while the final one was written with the non-dominant hand.
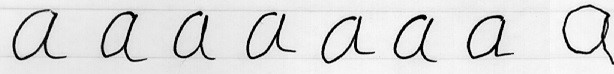
Figure 1.1: Hanwritten a’s
Now look closely at the seven letters on the left. Even though they were written under the same conditions – same hand, same time, same place, same pen, paper, lighting, and so on – they are not identical. Instead, even under essentially identical conditions, they show small, natural differences. This type of variation is called common cause variation because it is caused by the process itself.
When we see this kind of variation, it’s tempting to judge or rank the results deciding which letters look “better” and trying to copy those while avoiding the “worse” ones. However, this approach misses the point. Since all seven letters were produced under the same conditions, none is inherently better or worse than the others. From a process perspective, they are all equivalent. The differences between them are simply the natural result of the process.
So, how do we improve the quality of these letters? The key is to focus on improving the process, not the individual outcomes.
For example, we might try using a different pen or paper, practising more, or even switching to a computer. Intuitively, switching to a computer would produce the biggest improvement. Why? Because of the theory of constraints, which tells us that every process is like a chain, and its overall strength is limited by its weakest link. Improving that weakest link leads to the greatest overall improvement.
In this case, the weakest link is the act of handwriting itself. Changing the pen or paper won’t make a big difference – but removing the need to write by hand altogether (by using a computer) will.
Now consider the final letter in Figure 1.1 – the one written with the non-dominant hand. It stands out clearly from the others. This difference points to a special cause.
Special cause variation comes from factors outside the normal process and signals that something unusual has happened. When we see it, we need to investigate – like a detective – what caused it.
If the special cause makes things worse, we should try to eliminate it. If it improves the outcome, we should try to understand it and, where possible, build it into the process.
These handwritten letters illustrate the two fundamental types of variation:
Common cause variation
This is the natural variation within a stable process. It is predictable within limits and can only be reduced by changing the process itself.Special cause variation
This arises from specific, external factors. It is unpredictable and requires investigation to understand its source.
These ideas were first developed by Walter A. Shewhart in the 1920s as he worked to improve industrial quality (Shewhart 1931). Shewhart recognised that quality is not just about meeting specifications – it is about understanding and managing variation. He originally described these as chance causes and assignable causes, which later became known as common and special causes.
The key differences are summarised below:
| Common Cause Variation | Special Cause Variation |
|---|---|
| Comes from a stable, predictable system. | Comes from an external, identifiable cause. |
| Represents normal process behaviour. | Represents a signal that something unusual has happened. |
| Neither good nor bad – it simply exists. | May be helpful or harmful. |
| Requires changes to the whole process to reduce. | Requires investigation and specific action. |
| Also called random, chance, or natural variation. | Also called assignable or non-random variation. |
In summary, Statistical Process Control (SPC) is about understanding variation – what kind it is, where it comes from, and what to do about it. It’s not just about spotting outliers; it’s about improving processes and outcomes in a meaningful way.
As Donald J. Wheeler puts it:
Statistical Process Control is not about statistics, it is not about ‘process-hyphen-control’, and it is not about conformance to specifications. […] It is about the continual improvement of processes and outcomes. And it is, first and foremost, a way of thinking with some tools attached.
– Wheeler (2000), p. 152
With this foundation in place, the rest of this book focuses on the practical tools of SPC – especially the SPC chart. In the next chapter, we’ll explore the “anatomy and physiology” of these charts and how they can be used in practice.